whbob, I like your explanation. It’s like a static stem works as a seam in a pair of oversized pants. But if that’s the case, are the bases in the stem even needed at all; in real life could they just be deleted? Which brings me to the likely naïve question of how or who decides the starting number of bases in a loop?
Zama, the labs define the number of bases in the design sequence. Our current size is 85 bases. I suspect it might be a requirement of the size or type of chip they use. Sometimes our designs don’t need all of the bases and we tie up ends with hairpins etc. When we have two sequence strings in fixed locations with a lot of separation, I sometimes like to take in the length to see what happens.
In our current TB Lab A*B/C^2 Dec, I have modified one of whbob’s designs just changing nt7 from a G to an A. It makes no structural changes to his design.
In TB Round 2, this one nt change, G to A, when making no structural changes increased the eterna Lab Score by 37 points (nt 12 from G to A). See below for the comparison of the two designs.
https://docs.google.com/spreadsheets/d/1uYDFjPkH98acdLSGrXBrxCoA9kzq9pOgdAihWIH5XSs/edit?usp=sharing
Why wouldn’t this be a good change for this design in this TB Round? (nt7 from G to A)
http://www.eternagame.org/game/solution/8489874/8520084/copyview/ ![]()
First a big thx for making the spreadsheets and for sharing them.
Gerry, I count it very likely that your mutation is a good modification.
It results in a stronger bind to the reporter. Whereas whbob’s mutation has weakened it. (I have myself done multiple reporter weaking mutations through time. Especially the GU kind.)
While I have only looked through some of the designs in your DEC spreadsheet, what stands out already is that a good bunch of the mutations are mutations done to the reporter complement.
This makes good sense as the reporter binding is what get meassured and any change done to the bind should have huge effects for better or worse.
Unless reporter complement mutations are done at the end and prolonging the binding site to it, they are generally found in the lower scoring of the two design sets.
However there were one interesting case (number 4th best) where the mutation to the reporter complement had a largely positive effect. There it was a C mutated to a U - resulting in a UG between the reporter and the complement.
NT42 is U vs C
Lab score difference 49.45%
Better design
http://www.eternagame.org/game/solution/7113332/7213967/copyview/
Worse design
http://www.eternagame.org/game/solution/7113332/7213956/copyview/
The design with the U mutation did seem to make bind in one of the other states that would not be possible with C, so I can’t see if this is solely related to the reporter complement mutation.
It is the only case in the spreadsheet as far as I’m aware. I was checking as I found it peculiar.
Anyone having examples of designs with this particular mutation in the reporter complement, and a sibling design with the reporter complement unmutated?
Working reporter complement mutation
Why is it working?
This reporter is longer than in round 1 and 3. Johan said that it would bind even tighter because of that.
The reporter complement mutation happens exactly at the middle of the reporter
Such a weaking in the middle of a binding site for an input has shown itself rather helpful already with other inputs. Especially as they got longer. Like 20+ The logic gate labs often had not just a GU, but even a mismatch somewhere in the middle of the binding site. Or where there were a longer stretch of strong C or G bases.
I have looked at some older designs and this reporter complement with this mutation isn’t generally doing too well at least not when looking at fold change.
Score versus Global fold change
I mangaged to find an example more with this mutation (there will be multiple). It also increased the score. However it slightly decreased the global fold change. I wonder if that will be a trend.
Better score - with U
Eli Brourd mod #IN-SILICO_EVOLUTION, score 88.04, global fold change 0.03
http://www.eternagame.org/game/browse/7113332/?filter1=Id&filter1_arg2=7222656&filter1_arg1=…
Worse score - with C
Eli Brourd mod #IN-SILICO_EVOLUTION, score 83.43%, global fold change 0.08
http://www.eternagame.org/game/browse/7113332/?filter1=Id&filter1_arg2=7222617&filter1_arg1=…
Reporter Complement Mutation challenge
However a way to check if a specific reporter complement mutation is good or bad in a systematic way, would be to take a bunch of well scoring designs from last round and resubmit them plus a sibling design with a specific mutation to the reporter complement. That would make it easy to compare. Could be something like 10-20 designs.
-
Take designs from the two hardest labs with high global
-
Take designs from the two hardest labs with high score
Do the exact same mutation in the reporter compement.
I would love to see the best round 2 designs resubmitted a series with both the orginal and plus a partner design with only this middle C in the reporter complement mutated to an U.
If no one else ends up doing it - I will. ![]() But I’m passing off the challenge for now.
But I’m passing off the challenge for now.
Regarding Gerry’s DEC spreadsheet
There is another thing I find particularly worth noticing so far.
The two most extreme jumps in score (case 1 and 2) are related to one particular thing. Namely reduction in length of a real long switching stem.
Switching stems that get real long tends to get grumpy about switching. In these two pair of designs, changing one base resulted in the long switching stem, getting shorter and score dramatically increase.
Case 1, score difference 74.36%, NT56 is U vs A
Better, 10 basepair switching stem

http://www.eternagame.org/game/solution/7113332/7238520/copyview/
Worse, 12 basepair switching stem

http://www.eternagame.org/game/solution/7113332/7238516/copyview/
Case 2, score difference 56.72%, NT56 is U vs A
http://www.eternagame.org/game/solution/7113332/7238508/copyview/
http://www.eternagame.org/game/solution/7113332/7238514/copyview/
Gerry, there’s been a mistake someplace with regard to your first comparison. Your spreadsheet shows

i.e. the 37 point score difference.
But the data browser shows

i.e. approximately a 3 point difference.
Not sure where the confusion lies; it may well be with me.
I went back fresh and re-downloaded data [Eterna R105 (ABoverC2) results] and got the same numbers I downloaded before. I will email you the excel file.
@Gerry Looking at your 2’nd question, of your mod to whbob’s design, I don’t think there will be a significant difference in the results. Here’s my reasoning.
The first thing I did was look at NUPACK’s prediction for the two designs. It predicts no change in the folding and, very importantly, that the base you changed was in the middle of a solid stack. This is significant because all the folding engines are much better at predicting the energies of bonds in the middle of an unbroken stack than they are of loops or even base pairs close to loops. Here’s a cropped screenshot of states 3 and 4, with the base you changed from G to A marked.

The next thing I noticed was that that in both states, the pairs on either side of the changed pair are identical across the two states. This means that according to any nearest neighbor energy model, whatever energy changes there are as a result of your mutation, they will be identical for the two states. You can confirm this by checking the energy calculations for the two states when you make the substitution. The individual energy values differ between the two designs, but the difference between states 3 and 4 remain constant. This suggests that the individual KD values between the two designs will be shifted, but that any ratio of KD values within a design (aka fold changes) won’t change.
BTW, if you are wondering why I say a constant difference in predicted MFE energies suggests a common ratio between experimental KD values, it is because KD grows exponentially as a function of energy. Log(KD) values actually measure energy, and they could be presented in the same kcal units that the game displays. I think players as a whole could benefit a lot if the experimentalists actually reported the results in those terms, but so far I haven’t been able to convince anyone that counts. :-(
These two design’s histograms (links below) are so different for just that one middle of the stem G to A change. Pretty much all difference was due to Baseline subscore difference - from 1.37 to 30.
“The Baseline Subscore is a measure of how close the ON-state is to the the original MS2 hairpin (lower Kd is better, i.e., blue curve should be far to the left).”
But it seems like the histograms are saying a lot more than that is going on.
So to me, the data in the database seems suspect. If not, the Baseline score looks very misleading in this particular instance.
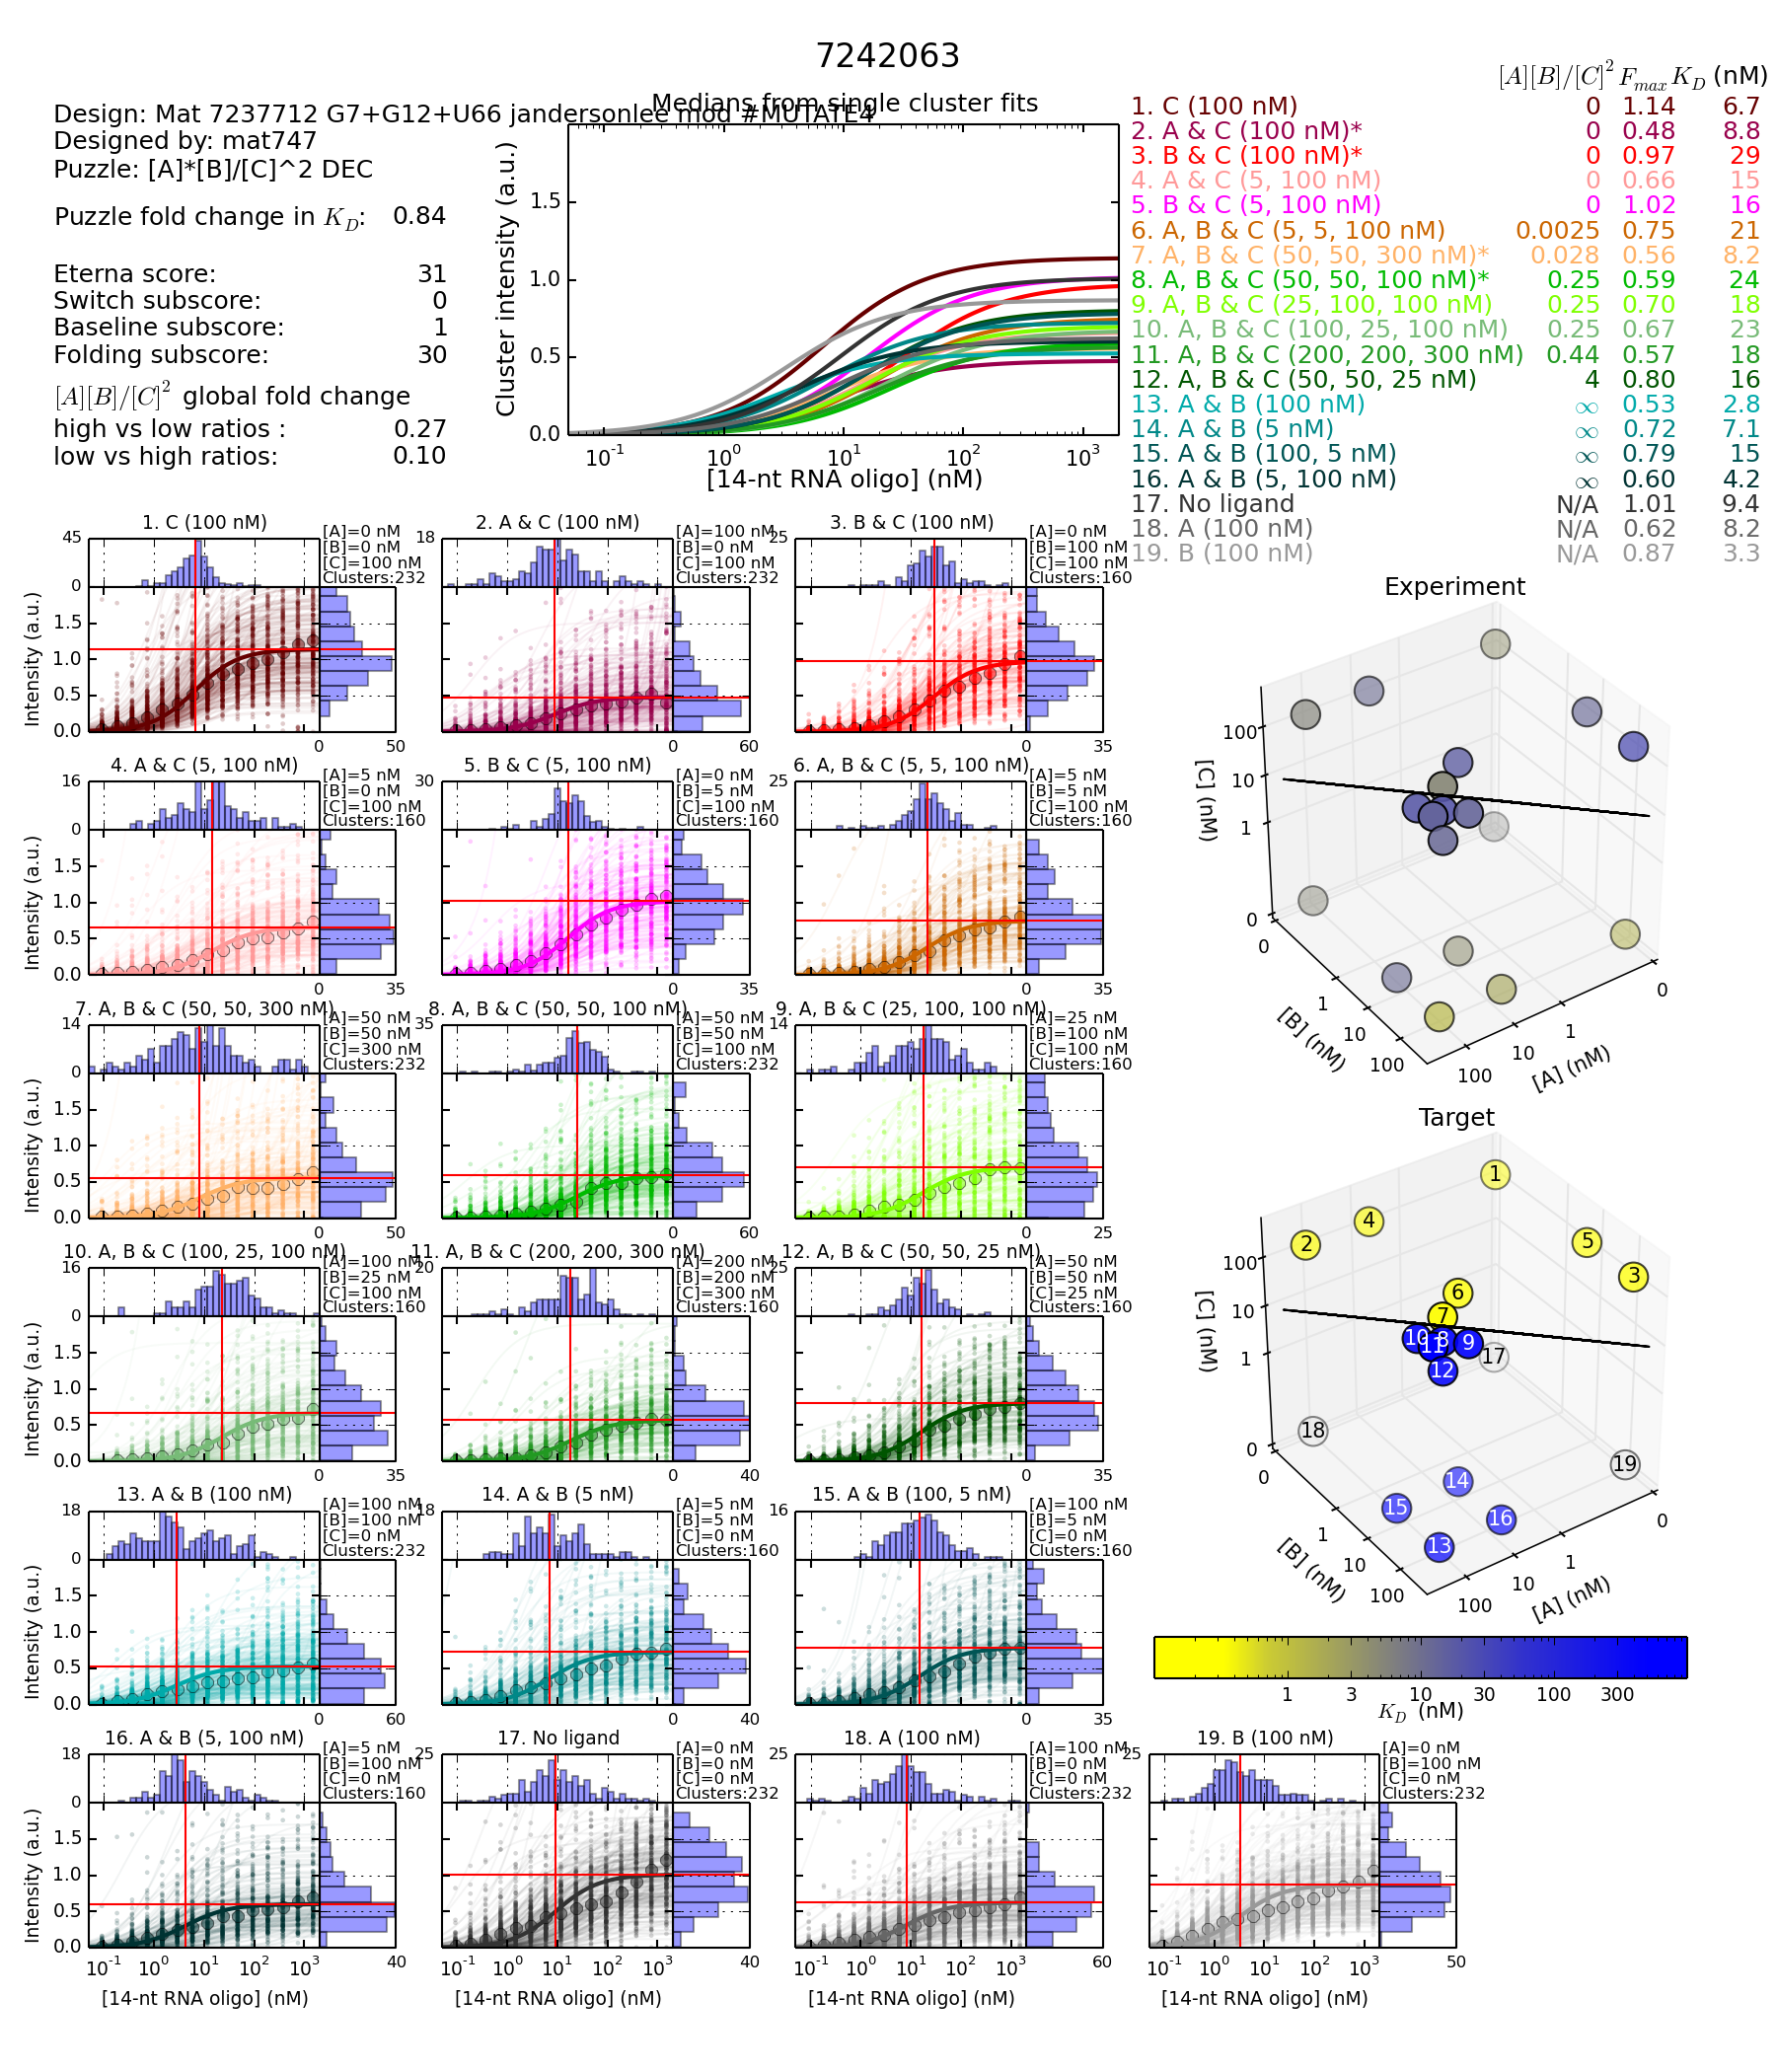
https://s3.amazonaws.com/eterna/labs/histograms_R105/7242063.png
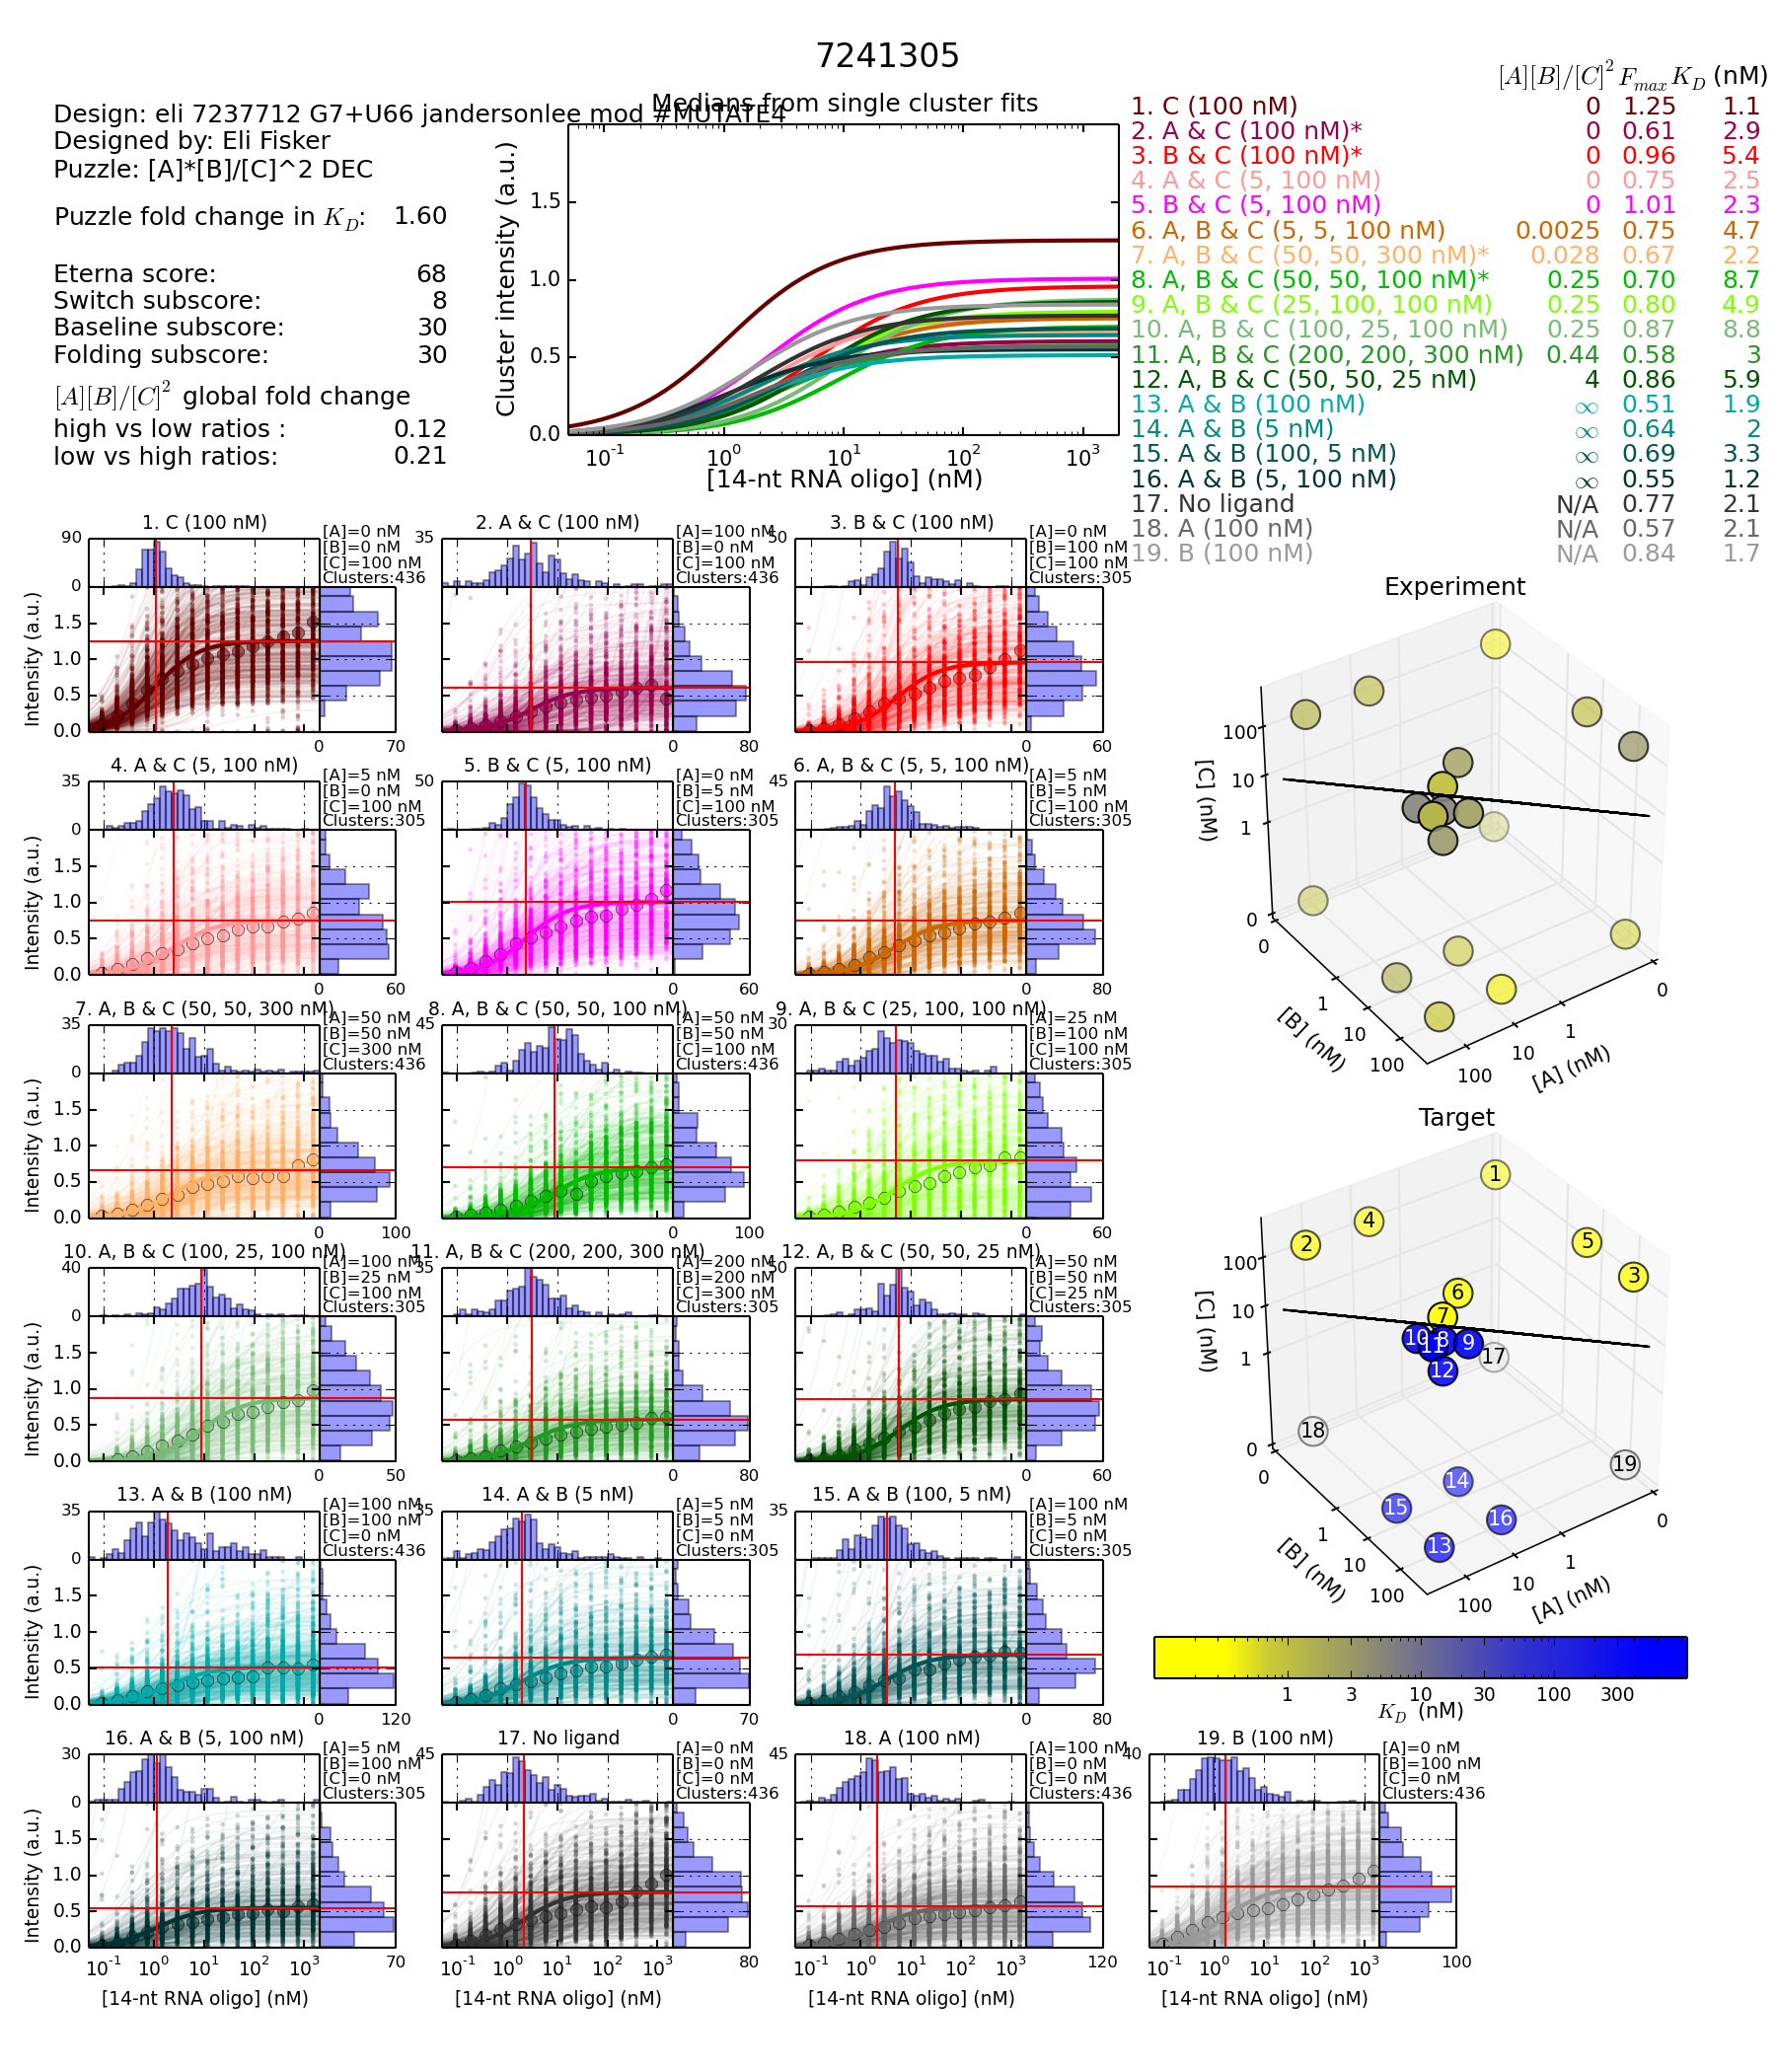
https://s3.amazonaws.com/eterna/labs/histograms_R105/7241305.png
Mea culpa! When I checked the data in the browser, I entered one of the design ids as 7241063 instead of 7242063. Me making that kind of mistake is not surprising. What is quite surprising is that the wrong ID with a difference of 1000 was not only assigned to a design (rather than some other Eterna entity), but that both designs were mods of the same jandersonlee design, with the result that it looked very plausible.
Anyway, I’ll go back and look at the pair you intended.
I don’t have a clear understanding of how baseline scores are calculated.
The difference in these two designs are the KD values of KD100BC.
The highest value of KD100AC, KD100BC or KD50AB_300C is used for the denominator to compute fold change. It’s a DEC lab so the numerator is always KD50AB_100C.
The folding engines give us a 2D structure that probably is not always correct.
KD100BC is 29 under a KD50AB_300C numerator of 24 giving a very low fold change.
I think that means when TB-B and TB-C are in the mix, it takes a whole lot more reporter concentration to get the same illumination.
I need help understanding this also. I’m just guessing, but I think it’s oligo interactions that need to be considered along with 2D structure design.
2 Likes
On the design links that Gerry shared above
I have highlighted the 4 concentrations for the 4 states. Green - reporter ON - Red - reporter OFF.
Design with the G12 mutantion (Worse) - Mutation to the reporter complement

https://s3.amazonaws.com/eterna/labs/histograms_R105/7242063.png
Notice that the KD for concentration 8 for the OFF state is very similar to the highest concentration for the ON states. If just calculating simple fold change, the fold change gets calcucated as the difference between the ON and OFF state.
Fold change calculation 24/29 = 0.83
Concentration 8 (for the 4th state) divided by the highest KD (worst) for the three first states.
There is very little difference in shift between the ON and OFF state.
Design with the A12 mutation (Better) - Reporter complement unmutated

https://s3.amazonaws.com/eterna/labs/histograms_R105/7241305.png
Fold change calculation 8.7/5.4 = 1.6
Concentration 8 (for 4th state) divided by the highest KDON (worst) for the three first states.
Reporter mutation pattern
I can’t say weather the data is good or not. Just that these two design pairs follow what I have come to expect from what I have seen so far in your spreadsheet.
The reporter is not at all happy about getting its binding complement mutated. All mutations to the main part of the complement have done bad. Only a few at the ends that increased reporter binding, were among the better of the mutants.
When we tamper with the reporter binding site we affect every measurement.
The design with the worse score and the G mutation is has higher KD values for the 4 star marked values in the switch graph. Meaning it takes longer attaching.
1 Like
@Omei, on what you said here:
"BTW, if you are wondering why I say a constant difference in predicted MFE energies suggests a common ratio between experimental KD values, it is because KD grows exponentially as a function of energy. Log(KD) values actually measure energy, and they could be presented in the same kcal units that the game displays."
Could you give me a worked example of a couple of lab designs, where you think knowing MFE and Log(KD) values would be real helpful? I will like to see and understand.
I haven’t forgotten that you some time back thought that seeing the switch graphs in a 3D view would be pretty helpful. Which it in deed turned out to be.
The switch graphs that Gerry shared above are for two designs that have only one base different. So they are quite similar, but their switch graphs and scores are quite different.
And it just hit me while I was looking at the switch graphs and just habitually swapping back and forth.
That this would be an excellent way for getting a feel for what is good and bad in the smaller graphs. Since these are for practically the same design. And one can literally see the switch. I think this can be a way to learn to read them better.
https://s3.amazonaws.com/eterna/labs/histograms_R105/7242063.png
https://s3.amazonaws.com/eterna/labs/histograms_R105/7241305.png
1 Like
OK. RNA folding can be subtle, and I can’t always find a reasonable explanation for the lab results. But in this case, I think I can.
First, let’s compare the overall results between the two designs.

I’ve chosen to focus on the “3D” chart because it highlights the fact that the largest difference between the two designs is the second design is the overall more blue. There are small differences in how each KD measurement changes, but they are secondary to the observation that all the KD values are generally higher for the second design.
What this means is that for some reason, the reporter did not bind as well to the second design, in all of the measured states. Given the very small predicted change (0.1kcal) in MFE energy created by the mutation, this seems suspicious.
However, we always have to keep in mind that in reality (including, but not limited to, the lab), RNA does not adopt a single folding. Individual molecules are continually changing between foldings, while the MFE folding only show the (estimate) of the most common folding. What the lab really measures is an average over the entire ensemble of possible foldings, weight by the percentage of time being spent in each.
To see something of what the energy models predict about the ensemble, we need to look at the dot plots.

The dot plot in the game only describes the state in which no inputs or reporter are present. NUPACK can generate dot plots (or “partition function” displays) for all the states, but you need to use their web server (or download their code) for that.
What the dot plot comparison shows is that while the single mutation made little change in the MFE folding energy, it had a significantly larger change in the ensemble of foldings. In the second design, a folding which is essentially one long hairpin with multiple interior loops and bulges has low enough energy that it shows up on the dot plot. Since this “native” hairpin involves the entire sequence, it is going to be working against any of the oligos, including the report, from binding. Hence the KDs are raised for all states.
If we wanted to take it farther, we could get individual dot plots for each state, and probably get a pretty good prediction or which states would be more or less affected. But from my perspective, this seems to be a design that NUPACK models quite well, and so we have little new to learn from the lab results. The designs to spend more time puzzling over are the ones where the in silico predictions and the lab results are in conflict.
2 Likes
I have been asking Omei more questions about the MFE idea. Here comes his answers.
Eli: I’m still not sure I understand why the MFE is important. You mentioned it in relation with two similar designs and a MFE difference between them. So is it only useful between closely related designs. Or also for more distant ones?
Omei: Given several (unrealistic) simplifying assumptions, log( FoldChange) in the lab would be perfectly predicted by the difference between MFE values in the game. This is what we are relying on when we use the folding engines to get us into the ballpark when it comes to predicting whether our designs fold into shapes appropriate to each state.
The fact that the specific mutation didn’t appear to have much effect on the energetics of the minimum energy foldings just made it easier for me come to the conclusion that something else was going on in the ensemble, which led me to look at the dot plots.
Question on the switch graphs
So far it appears to me that it seems to be better to have the early part of the curve (left) in the switch curves than a more slow cap curve.
However no it is I who has some questions about two switch graphs.
I took notice of a pair of designs in the DEC spreadsheet that Gerry just shared of similar designs versus their difference in global fold (GF) change.
These two switch graphs looks very different. Also very different to the DEC designs with the best GF. Their switch curves raise in the air real fast. The best one has it raising a bit faster. I have no idea what it means. Is it good or bad? And more specifically, why?
Better GF

http://s3.amazonaws.com/eterna/labs/histograms_R105/7165562.png
http://www.eternagame.org/game/solution/7113332/7165562/copyview/
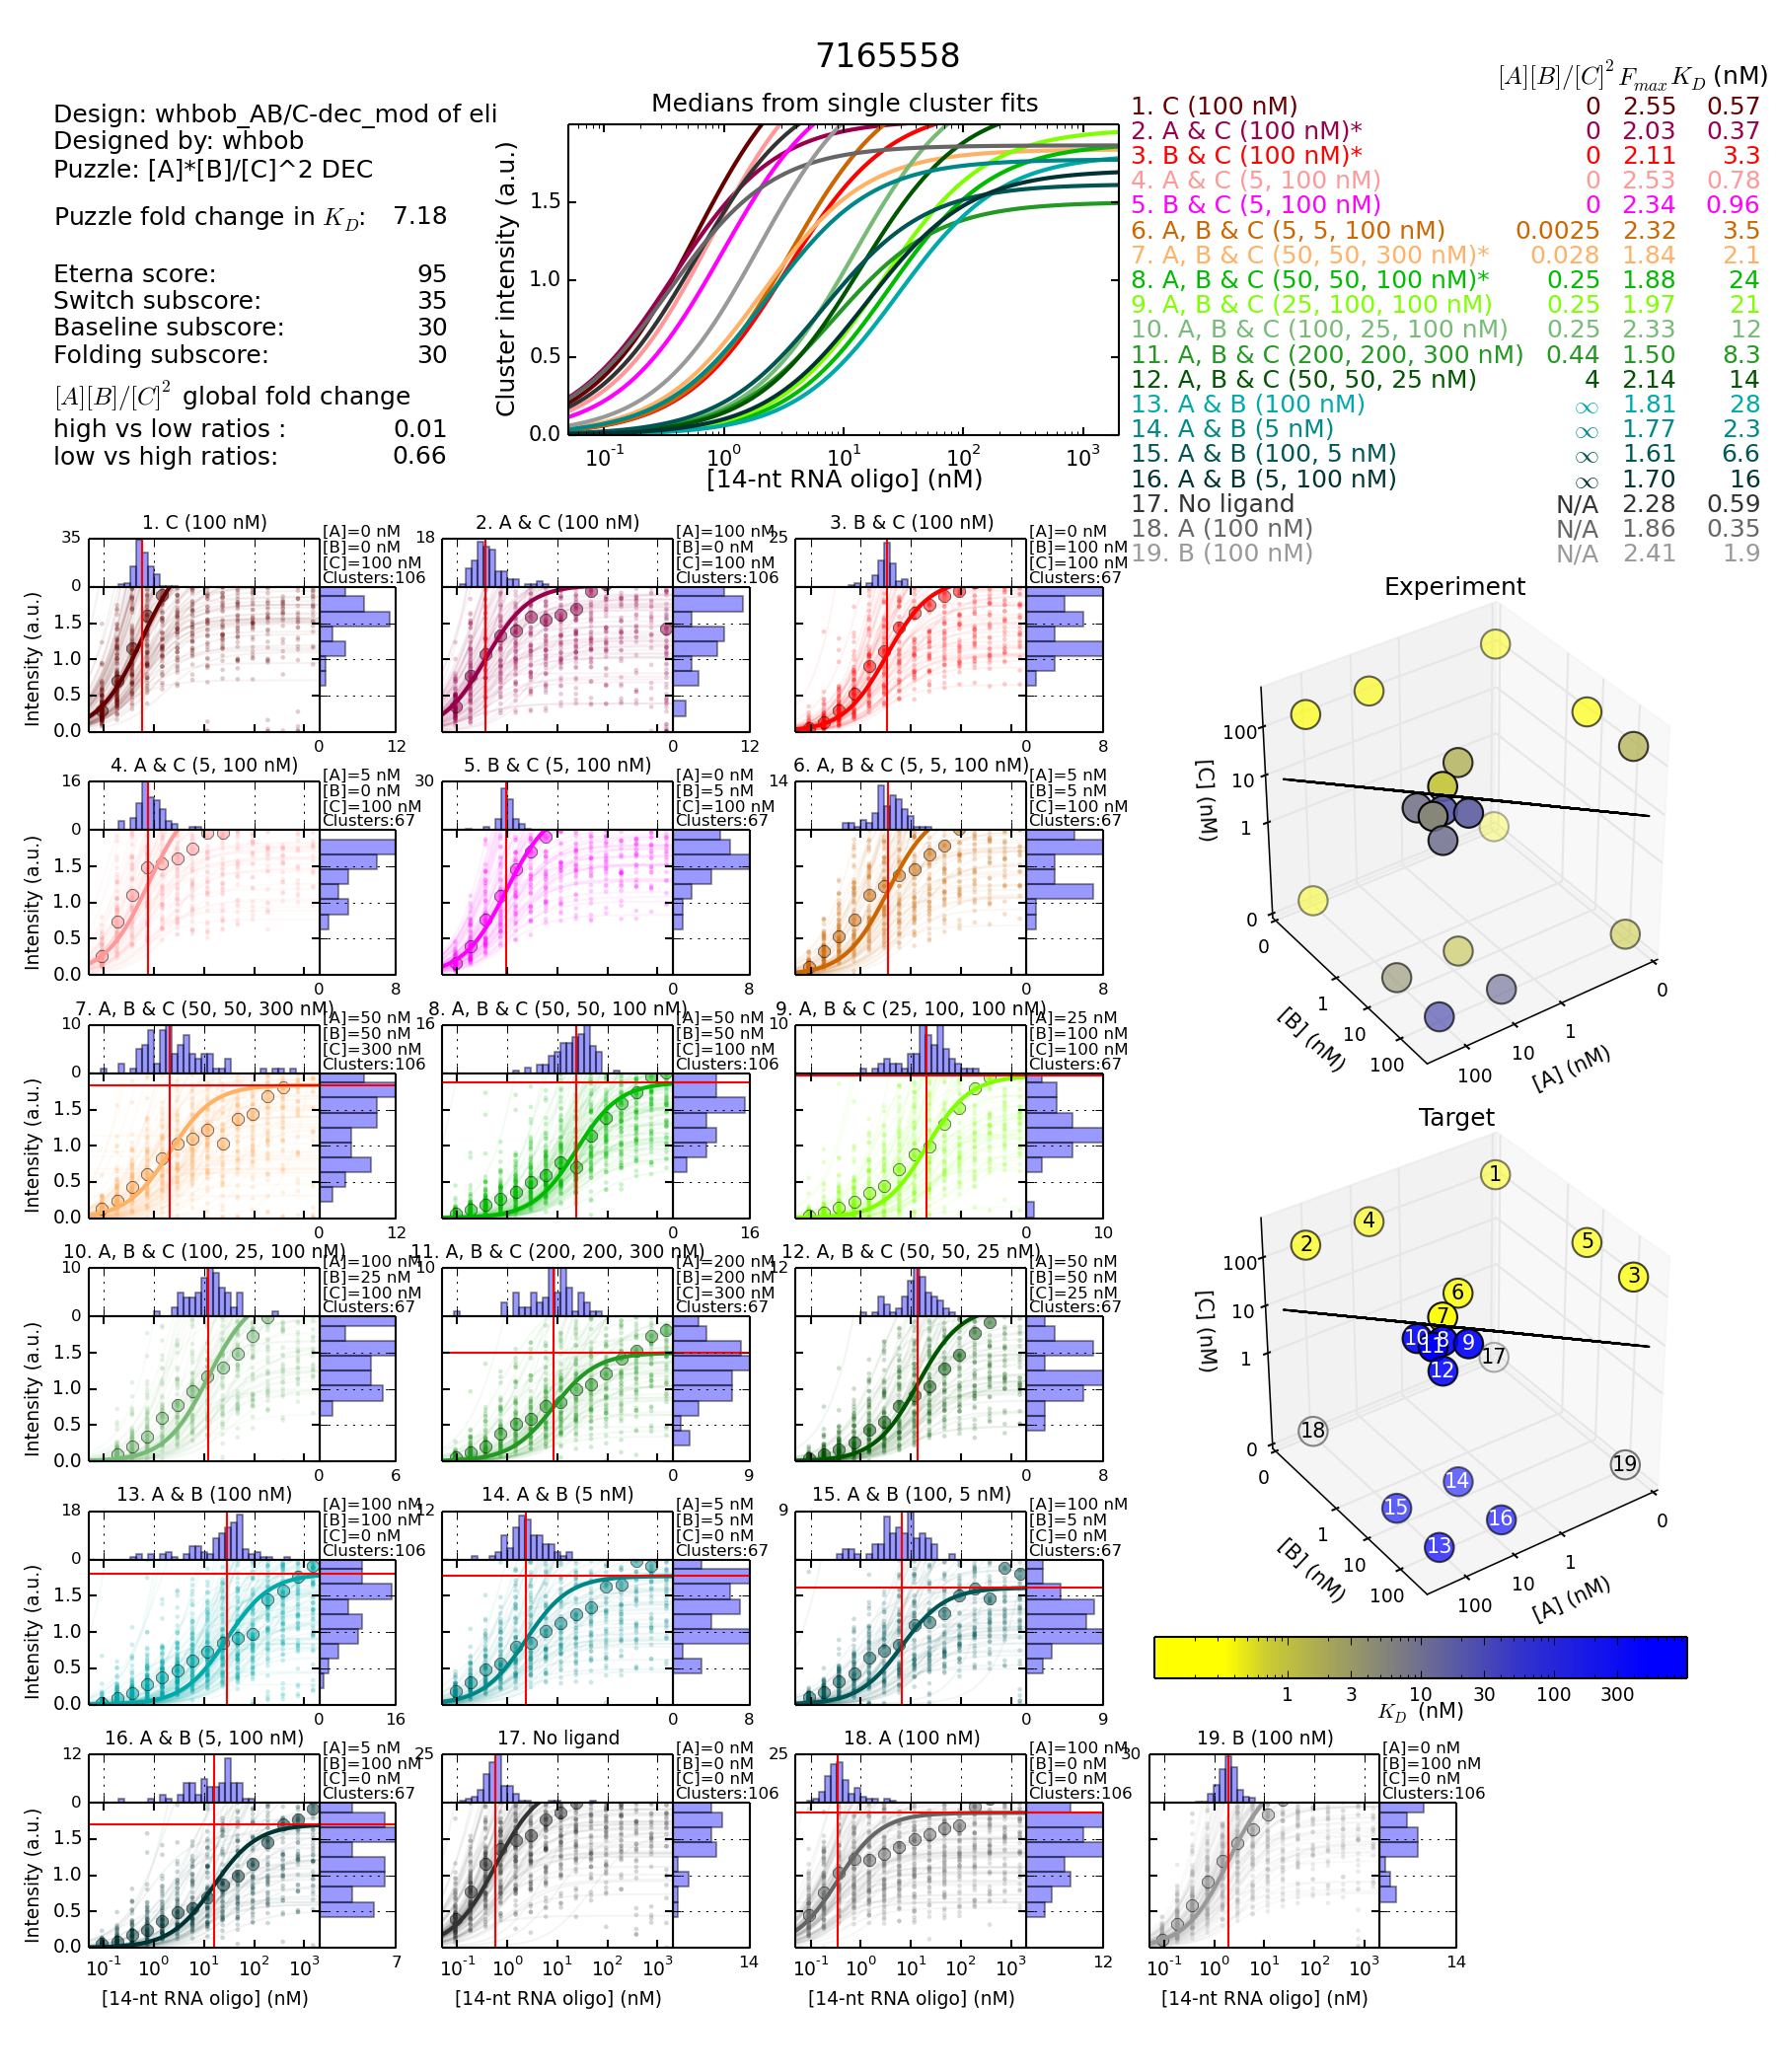
Worse GF

http://s3.amazonaws.com/eterna/labs/histograms_R105/7165558.png
http://www.eternagame.org/game/solution/7113332/7165558/copyview/
This is a puzzle that depends on input overlaps (competing inputs) and binding to as much of the inputs as possible.
Whereas the main part of the designs I have seen in Gerrys spreadsheet for now attracting big score and GF change are of the entangled kind. Aka Brourd/Nando’s puzzles.
Basically I wonder if different types of switch puzzles will have different kind of switch curves.
And especially if we can use this for something. ![]()
Now there is one thing more. The actual mutation difference between these designs are to a tiny switching hairp at the tail end. I haven’t seen many of these paired designs with this kind of mutation. But I find it interesting as this mutation outside the main design, caused a GF enhancement on 0.77. Even by strengtening the switching hairpin.
Nb. Another interesting thing is that the design with the worse GF, recieves a better score.
Aha! It dawned on me that the extreme raise in curve has to do with Fmax.
I asked Omei explain it to me earlier.
Omei: Ideally, fmax will always be in the range of 0-1 (assuming only one instance of its binding site), and it represents the proportion of designs that will bind to the reporter when the reporter concentration is extremely high.
If there are 2 reporter complements, designs should be able to get an fmax score of 2.
Eli: So is fmax a measurement of how many reporters are able to bind up with a high concentration of the reporter. (Be it a molecule, hairpin or microRNA.)
Omei: Each reporter molecule adds a bit the light intensity, so the more the brighter.
The designs I showed switch graphs for in the above post, indeed have two reporter binding sites. One of them even comes at ends of the sequence where it has a easier time binding.