As there keep coming questions on how to read the raw switch data, I have decided to make a intro. It is not as hard as it looks at first. Once you know what columns to read and what to look for, it gets much easier.
First I have marked the areas in the puzzle that is supposed to switch. After that I will mark the same spots in the raw switch data.
Here is the hairpin with the switching areas marked. The first column in the raw data have data for the hairpin shape. Depending on there being a black line or not, it shows if the nucleotides is actually bound or unpaired in this shape. The red circles tells you what they are supposed to be. More on that later.

Below is the molecule-bound shape with the areas for switch marked. The second column in the raw data holds the data for this shape.
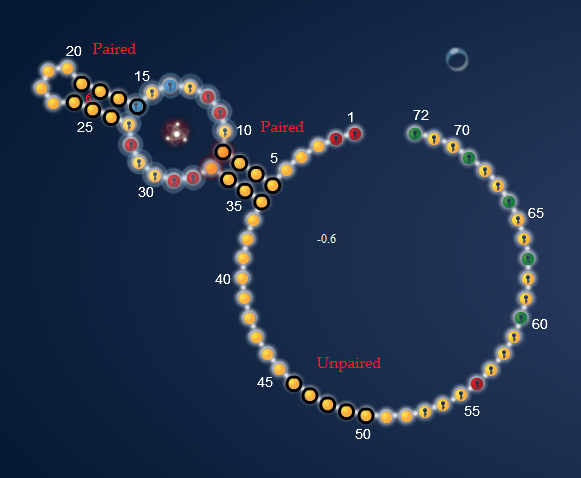
To read the raw data you need to focus on the first two columns (from the left) in the raw data picture. The first colum is for the hairpin shape. The second column is for the molecule-bound shape, that should bind up with the FMN-molecule. I have marked the areas where switches are supposed to occur.

In the raw data a dark line means unpaired.
The red circles marks where a dark line should appear if the design is good.
Notice that there are only circles in the one side of the boxed switching areas. That means that for a switch between the two RNA shapes to occur, there should only be dark lines in the one of the two columns – under those red circles.
Remember the first colum represent the hairpin and the second collum, the molecule-bound shape. So when the lines disappear in the second column for the four out of five switching spots, that means that those nucleotides are no longer unpaired, but should preferable be paired up with their intended partners. Except for that 5 spot that is the locked nucleotides in the hairpin string. Those should end up as single nucleotides.
Two black lines and a base number
![]()
If there are two black lines in column 1 and 2, that means that nucleotide has not bound in either the two switching shapes. This is bad. No binding means no switching.
Two white “lines” and a base number
![]()
If there in column 1 and 2 is only white, that means the nucleotide is bound in both shapes, and not letting go in the one of them, as it is supposed to. This is bad. Totally binding means no switching.
One black line and one white (or fainter line)
![]()
![]()
Changes in the tone of the line, between the two columns, means a switch occurred. Preferable it should be black one place, and white in the next. But even the slightest switch in the right direction, counts when points are given.
Now to see if the switches actually occur in a specific area, we will take a closer look at the raw data sheet. Lets zoom in on the spot nucleotide 16 to 19 that represent one of the switching areas, the one where Rhiju mentioned that nucleotide nr. 19 did not switch in his analysis of my design.

Reason why 16-18 gets point is that the lines gets fainter in that second column where there are no circles. The line at base 19 does not appear to get fainter, so no switch or a hint of a switch.
And one last thing. When it comes to switch designs, you can’t trust the shape data alone. You need to look at the raw data, to see if the switch occur.
EXTRA - idea for what to do with the raw data
Here is how I use the raw data. There should be other ways to go at the lab, and if you have any ideas, please go ahead - just read those raw data…
I pick one of the five switching areas that I want to improve. For that I pick a high scoring design, that does already do well in that area, but have one or two unswitching nucleotides.
My thought is that we might be able to see which nucleotide (A,U,C or G) does best at switching at a specific base.
Eg. I want to make a change at base 19 as it isn’t switching well. If I put a U at base 19, is it then capable of being involved in an actual switch, in any of the lab data? So you look through the designs that happen to switch well here. And count which and how many of the U, G, C and A bases that does well and count those too that does not switch. That should give you a picture of tendencies.
If U at base 19 appears to be switching well and the other bases have less success at that spot, then it might be a help on picking the right color at that specific problem spot. Of cause there is a whole basepair involved in that particular switch, so the partner to the nucleotide you are interested in, should be watched the same way too.
Honestly I don’t care what score a design have, as long as it have a proper switch at that spot I look at. As Brourd pointed out, that approach might lower the value of my data. True enough. But I think if a nucleotide at this spot several times have shown itself capable of being involved in a switching, that enhances the chances of me picking the right data, even though looking at low scoring designs. And it is a risk I’m willing to take until I figure a better way to do it.
Can’t guarantee this method will work. Just some early thoughts on how to get the unswitching spots to switch.
Good luck with the data mining ![]()