May we have a definition and explanation of the Shape Variables?

Hi All,

In the Lab Data CSV flie download (see:

http://getsatisfaction.com/eternagame…

) …there are 4 columns entitled 1) Shape, 2) Shape Thresh-hold, 3) Shape Min, and 4) Shape Max;

I’d like to request please, if we may be given definitions and explanations about what the figures in these fields represent, how they are derived, how they are to be read and understood, and what is the general significance of each of them, and also optimal ranges for each, if known.

Thanks, and Best Regards,

-d9

:slight_smile:

Hi dimension9,

We are sorry about the late response.

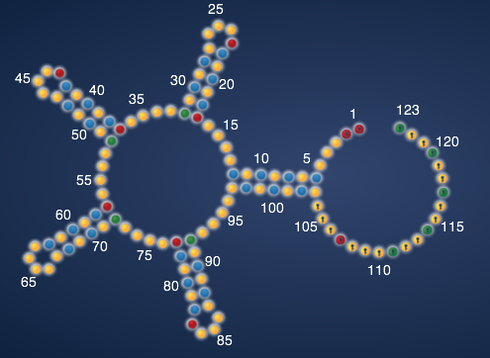
The SHAPE data basically represents how “Blue” and “Yellow” each base is. Right now in the game, we only show “blue/yelllow” in a binary fashion, but the data is actually continuous - our synthesis pick a borderline between blue/yellow and mark every base with SHAPE data less than the threshold blue and others yellow.

This was for the sake of simplicity in analyzing results - We are actually planning to eventually release expert view mode where you’ll be able to see varying degrees of “blue/yellow” based on the SHAPE data.

EteRNA team

Could this be why: Prevotella Albensis never got solved?

It’s incredibly exciting that you have this level of detail available. I look forward to using it someday. Keep up the good work!

I can’t make this work out. I’m looking at lab 103 submission #298874. It has the following SHAPE data:

SHAPE threshold: 0.1
SHAPE: 4,

0.121,

0.153,

0.018, -0.036,

0.089,

0.074,

0.045,

0.168,

0.282,

0.214,

0.125,

0.012, -0.019,

0.035,

0.105,

0.124,

0.090,

0.047,

0.041,

0.132,

0.195,

0.153,

0.085,

0.088,

0.109,

0.158,

0.182,

0.144,

0.101,

0.094,

0.095,

0.112,

0.172,

0.189,

0.136,

0.181,

0.334,

0.371,

0.253,

0.079,

0.098,

0.296,

0.327,

0.209,

0.174,

0.357,

0.469,

0.243,

0.109,

0.190,

0.168,

0.085,

0.171,

0.206,

0.102,

0.020,

0.113,

0.028, -0.275, -0.306, -0.042,

0.082, -0.003,

0.064,

0.108,

0.030, -0.092, -0.132, -0.189, -0.252, -0.237, -0.338, -0.964, -1.216, -0.495, -0.012, -0.338

But the SHAPE numbers don’t line up with the yellow/blue bases. I assumed numbers greater than the threshold are supposed to represent yellow. and numbers less than the threshold are blue. But then the yellow bases should be (as a start): 4,5,6,12,13,14,15,19,20,24,25,26…

But the ones that actually display yellow are (as a start) 4,5,6,13,25, 26…

It seems like SHAPE and blue/yellow are related in some way, but not in an obvious way. Can someone give me a nudge in the right direction? I have a spreadsheet trying to do some analysis but this is the stumbling block.

Or maybe you aren’t actually displaying enough yellow bases!

Turns out I had a bad copy of the CSV file, which apparently won’t happen again. Oops!

Hi all, thanks again for the perceptive questions.

The list of numbers are the data themselves, except the first number. The first number in the list is a sequence offset – we don’t always get data for the first few nucleotides for technical reasons, and that number defines the first nucleotide for which an experimental value was obtained. (or maybe the first nucleotide - 1 --> Jee can you confirm?)

The data are the chemical accessibilities of each RNA nucleotide to the ‘SHAPE’ reagent, developed by the Weeks lab at UNC. For the aficionados, the reaction is an acylation of the 2’ hydroxyl of the RNA nucleotide by a reactive anhydride. Strongly modifed nucleotides, at least empirically, correspond well to ‘flexible’ regions of the RNA, i.e. the ‘unpaired’ parts of your EteRNA designs, if they fold correctly.

The values (min,max, and threshold) define the coloring that you see in the EteRNA viewer (threshold is white, anything at min or below is blue, and anything at max or above is yellow). These also are parameters in determining the EteRNA score:

(A) for regions that should be base paired: you get a point if the score is less than the threshold.

(B) for regions that should be unpaired: you get a point if the score is above a fairly low cutoff given by [(1/4) threshold + (3/4) min].

[We should probably make a graphic of this.] For the EteRNA score, the points are then divided to the maximum number of points (the number of nucleotides for which there is data), and then multiplied by 100.

The score was designed to be fairly accommodating but still correlate well with the designs whose SHAPE data ‘looked’ good. We are also further checking this score on several natural RNAs with known structure (stay posted on this).

The last point is the setting of min, max, and threshold – we actually optimize these 3 parameters for each design’s data via a linear program so as to give the design the maximum possible score. Again, we’re trying to give everyone the benefit of the doubt.

For the curious, we’ll soon have the data in text file format, as well as the actual raw electropherograms (which are quite beautiful, in my opinion) on a publically available website that our lab just started:

http://rmdb.stanford.edu

Stay tuned – the pipeline from EteRNA should start in a couple weeks.
Thanks for the response and explanation, rhiju.

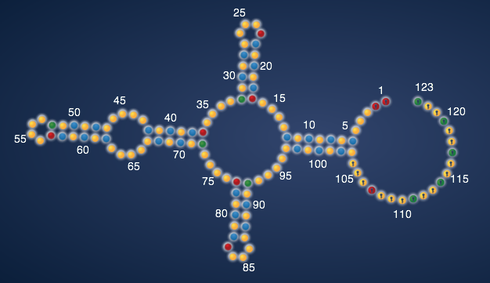
I’m also curious about how the estimated shapes are generated. Does the SHAPE data give you any information about which pairs are being formed, or how can that be extrapolated from the data? For example, could the data tell you which of the following two shapes is generated?


edit to add: the new website looks very cool, I can’t wait to explore it and to see some EteRNA results up there :slight_smile:

Excellent, excellent question with excellent picture. Give this man a medal of some kind.

Wow, that is a really, really good question. My understanding of this (please correct me if I’m off-base here Das lab) is that the estimated shape is just the same eteRNA natural mode that we all know and love but with “SHAPE” information about individual base-accessibility added as a constraint on the most-likely structure. As Rhiju notes, this information contains no contextual information about who the base-pairing partners are, just the presence of absence of conformational accessibility at the 2 prime hydroxyl.

So the simplest answer to Ding’s hypothetical question above is NO, the experiment can’t tell any difference between those two shapes he hypothetically created, but the “lab estimate” will only show whichever of those two shapes has the most negative free energy.

The original citation is here:

http://www.pnas.org/content/106/1/97…

someone let me know if this link is restricted for non-academic users so I can find a free access link.

Is this still correct?