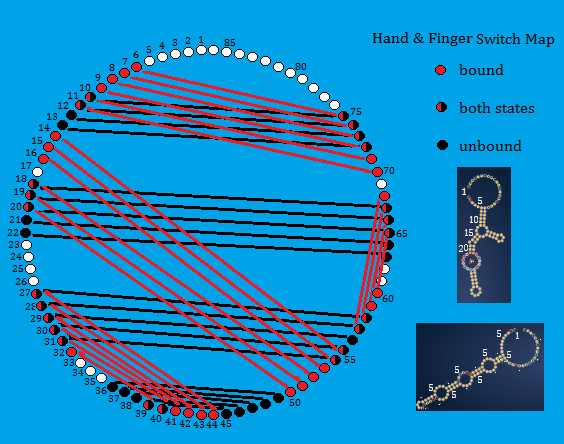
Switch Puzzle visualization tool.
The circle graph with numbered nucleotides connected by chords representing each base pair for each of the two states. Each state has a separate color, each nucleotide unique to one state has same color dot and chord, nucleotides in both phases have bi-color dots and two differently colored chords.
Makes seeing the switch very apparent and should help visualize solutions. I made a hand drawn representation if someone will instruct me how to share.
Here’s a picture (I hope)

like this idea. would be really interested to see this plotted against a few other switches
Thanks. This is apparently how the working designers look at things. Not only do you see the stacks, loops, and slides but also the dependency pathways for changing a base as it moves from one state to the other.
Did you catch my error in the drawing?
I left 4 base pairs that should be black as white.
I could post the blank circle form if anybody wants–good to 85 base pairs.
eternacac, did not in fact notice the error (the ~31 to 34 i think).
The more interesting (to me) chains, are those that bounce between 4 or 5 pairs.
A plot like this on “mod jet plane” would be really interesting (it has both recursive pairs and pairs that do not unpair in either state - do not believe any other switch has either).
Your visualization would show both right away.
Yes, seeing the chains is very direct and helpful. I’ve made a chart for Hand & Finger Switch lab, maybe I’ll get to “mod jet plane” too.
One chart could be distributed to all interested players.
Any script writers out there? Hint, hint.